Amazon offers access to a global customer base and plenty of resources to help you run your Amazon store. Nevertheless, it is also a highly competitive space. It thus takes research, strategy, and determination to become a successful seller.
Monitoring your performance over time allows you to identify whether your selling strategies are working or if you should make adjustments. However, you first need to specify your key performance indicators and how to measure them.
Not sure where to begin? Come along as we define and outline Amazon KPIs, why they matter, and how to measure them.

What Is an Amazon KPI?
An Amazon Key Performance Indicator is a metric that you can evaluate to ascertain how successful your Amazon store has been in different aspects of selling.
For example, if you invest in advertising for your Amazon listings, you may need to evaluate whether the ads are bringing in any sales. High sales prove the ads are doing well while low sales may imply that you need to reevaluate your ad strategy.
The number of sales brought in by your ads would, therefore, be the Amazon KPI, in this case.
Why Are Amazon KPIs Important?
Amazon KPIs go a long way in helping you excel as an Amazon seller. Here are some benefits you can gain from monitoring them.
Definitive Data
Measuring Amazon KPIs gives you definitive data in facts and figures. You can, therefore, confidently make decisions because you have a solid point of reference on:
- Whether you need to make changes
- What changes to make
- How extensive your changes should be
Improved Management
Amazon KPIs include cost, inventory, and customer satisfaction metrics, among many others. Evaluating them enables you to identify challenges such as:
- Inefficient order processing
- Cost inefficiencies e.g. expensive ads or shipping carriers that do not offer commensurate value
- Inadequate or bloated inventory levels
- Conversion barriers
- Shipping inefficiencies
- The rate of returns
You can, in turn, address these issues, run your store more efficiently, and raise your chances of making better profits.
Spotting Opportunities

You can easily identify opportunities to boost your profits or grow your Amazon business by monitoring your KPIs. This is especially common when your indicators provide positive feedback.
For example, if you notice that a product runs out of stock very often, it could be because the product is popular. This would, therefore, be a prompt to stock more of it and capitalize on its popularity.
Important Amazon KPIs Worth Monitoring
As we have mentioned above, Amazon KPIs cover different aspects of running an Amazon store. However, you (the seller) get to decide which KPIs you would like to monitor. Let’s explore some of them, shall we?
Unit Session Percentage
Sessions are the number of times that customers view a product listing.
The unit session percentage, therefore, measures the number of times that customers who view your listing end up buying the product from your store.
A high unit session percentage indicates that your listings and product are faring well. Meanwhile, a low session percentage suggests that you may need to improve the quality of your product listing or that the product is not popular.
KPI Evaluation
You can calculate your unit session percentage manually as below:
Unit Session Percentage = (No. of Sales ÷ Total No. of Sessions) × 100
Alternatively, you can find the details on the number of sessions and sales and the unit session percentage on your Amazon Business Reports as follows:
- Access your seller dashboard
- Select ‘Business Reports’
- Click on ‘By ASIN’
- Select ‘Detail Page and Traffic’
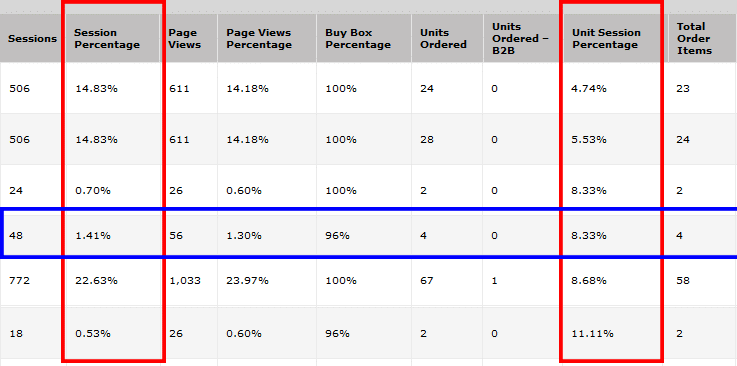
Session Percentage
A session percentage is the ratio of customers that view products under an ASIN and choose to buy the product from your store.
A high percentage is ideal but a low percentage may indicate that you need to reconfigure your listing.
Additionally, notice that this KPI distinguishes that it measures scenarios where a shopper has multiple search results but clicks on your product listing and buys.
It is not like the organic conversion rate where a shopper specifically views your listing based on a recommendation or due to other factors.
KPI Evaluation
You can find session percentages for your different product listings in your Amazon Business Reports. Simply:
- Access your seller dashboard
- Select ‘Business Reports’
- Click on ‘By ASIN’
- Select ‘Detail Page and Traffic’
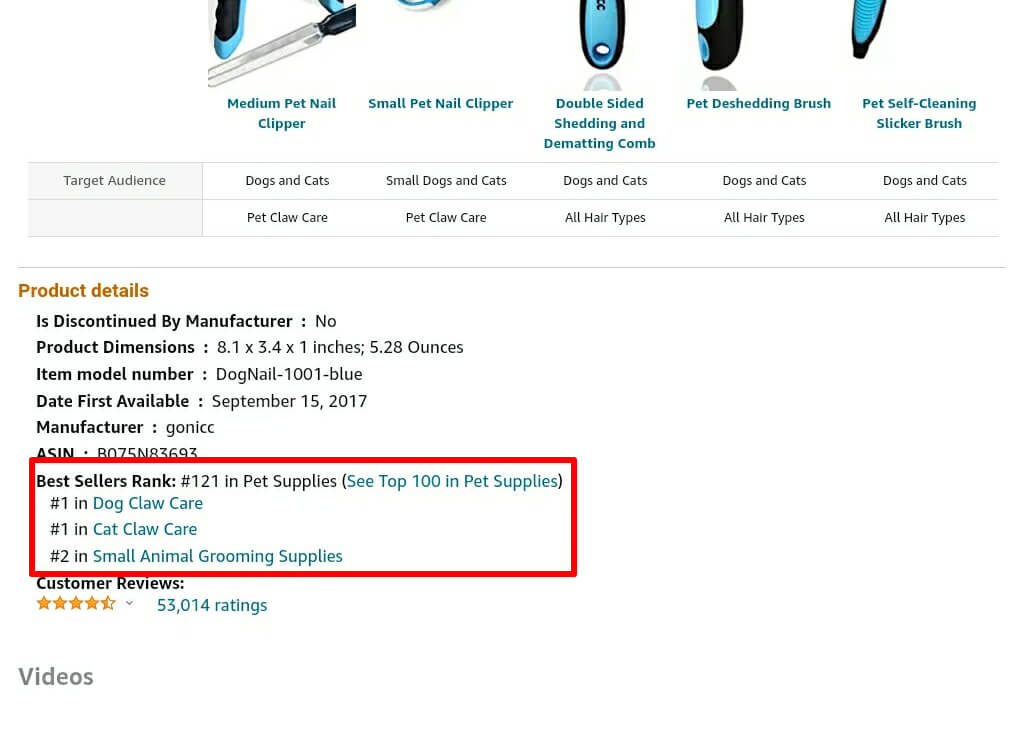
Product Ranking
A product ranking is a position at which your product appears in category highlights or among search results. It is determined by the Amazon algorithm based on factors like your customer reviews, click-through rate, selling history, and conversion rate, among others.
You may not have control over all these factors, but analyzing your product ranking could tell you whether you are getting them right or need to make some improvements.
KPI Evaluation
Amazon includes product ranking details in the product details section.
Average Order Value
An average order value is the mean amount of money a customer is likely to spend in your store per order.
The goal is to get customers to spend more per order so that you can make higher profits even with fewer sales. You can achieve this through product kitting or offering discounts or shipping incentives if a customer buys multiple items or spends a certain amount.
KPI Evaluation
Average Order Value = Total Sales Revenue ÷ No. of Sales
All your sales data is available through your seller dashboard in your Amazon Business Reports.
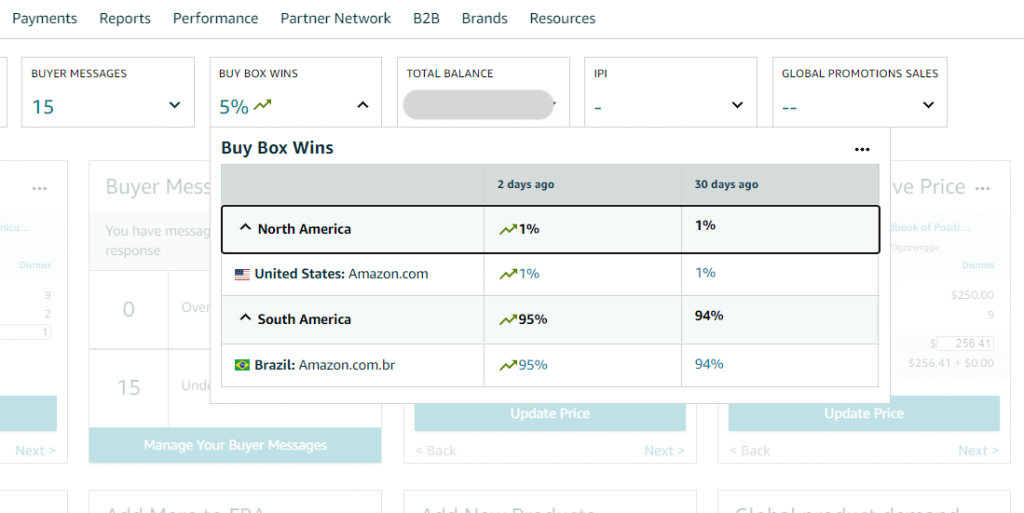
Buy Box Percentage
The Amazon Buy Box Percentage is a ratio of the number of times your product listing wins the buy box versus the number of times customers view the listing. It is also known as the rate of Buy Box wins.
A high Buy Box percentage is a tell-tale sign that you have quality product listings.
KPI Evaluation
The Amazon Business Reports include statistics of Buy Box percentages for each of your product listings. You can access them as follows:
- Access your seller dashboard
- Select ‘Business Reports’
- Click on ‘By ASIN’
- Select ‘Detail Page and Traffic’
Percentage of Sales New to Brand
The percentage of sales new-to-brand is a measure of how many of your total sales were made by first-time customers. It helps you gauge the effectiveness of your advertising strategy and identify areas where you could improve.
The higher the percentage the more effective your ads are at attracting new buyers. Amazon defines new buyers as customers that have not previously bought the item in question from your store in the last 12 months.
That said, this Amazon KPI is only available for Amazon Ads Display, Video, and Sponsored Brands.
KPI Evaluation
Percentage of Sales New to Brand = (Revenue from New Sales ÷ Total Revenue from Sales) × 100
You can also find comprehensive data on the percentage of sales new to brand as follows:
- Access your Amazon Seller Central account
- Select ‘Reports’
- Select ‘Advertising Reports, and Create Report’
- Click on ‘Sponsored Products’
Advertising Cost of Sales (ACoS)
The advertising cost of sales is the ratio of how much you spend on Amazon ads versus how much you make from them.
A low Amazon ACoS shows an effective ad campaign while a high one could indicate that you are likely spending more on Amazon ads than you are making from them.
KPI Evaluation
ACoS = (Ad Spend ÷ Ad Revenue)
You can access your Amazon Ads data and your ACoS as below:
- Open your Seller Central dashboard
- Click on ‘Reports’
- Select ‘Advertising Reports’
Return on Ad Spend (RoAS)
Return on Ad Spend measures how much you spend on ads versus how much they bring in within a specific duration.
For example, if you spend $500 on ads for 1 month and earn $3000, your RoAS would work out as follows:
RoAS = $3000 ÷ $500
=$ 6
This means that you make $6 of revenue for every dollar that you spend on advertising which is a fairly good rate of return.
KPI Evaluation
Amazon now provides data on ad revenue and ad spend on the Advertised Product Report among other reports.
- Open your Seller Central dashboard
- Click on ‘Reports’
- Select ‘Advertising Reports’
Ad Conversion Rate

An ad conversion rate is the number of sales you make due to customers clicking on one of your Amazon ads.
A high conversion rate (above 5%) indicates that your ad is effective while a low ad conversion rate (below 2%) shows that the ad may not be appealing to buyers.
KPI Evaluation
Amazon uses your sales data, ad CTRs, and impressions, to calculate your ad conversion rate. You can find all these stats by:
- Accessing the Seller Central dashboard
- Select ‘Business Reports’
- Click ‘Detail Page Sales and Traffic’
Click-Through Rate (CTR)

An Amazon Click-Through Rate is the percentage of people that choose to view your Amazon ads by clicking on them.
A high click-through rate shows that more people viewed your ad. This is a positive indicator that could boost your performance rankings on Amazon and increase your chances of conversions.
A low CTR may indicate that you need to improve your ad content, keywords, or placement.
The ads usually have a call to action or are tied to keywords that you bid for when creating your ad campaign. Amazon uses both the CTA and your campaign keywords to track how many impressions your ads make and compiles that data into a report.
KPI Evaluation
- Access your Seller Central Dashboard
- Go to the Amazon Campaign Manager
- Select ‘Search Term Report’ or ‘Keyword Report’ (they both show some data linked to your CTR)
Pre-Fulfillment Cancel Rate (PFCR)
A pre-fulfillment cancel rate is the number of orders that you cancel before confirming to the buyer that you have dispatched them. This could be because an item is out of stock or other unforeseen circumstances.
It is crucial to keep this KPI as low as possible through efficient inventory management. If your rate of cancellation is over 2.5% it creates a negative experience for customers and Amazon may suspend your seller privileges.
KPI Evaluation
PFCR = No. of Seller-Initiated Cancellations ÷ Total No. of Orders
You can find the data on both orders under ‘My Orders’ under the Seller Central Dashboard.
Order Defect Rate

An order defect rate is a ratio of the number of orders under your seller account that received negative feedback versus the total number of orders.
Amazon measures negative feedback based on the number of Amazon Chargebacks or A-to-Z Claims that arise from your orders. It is best to aim for an order defect rate below 1% to avoid the suspension of your account.
KPI Evaluation
ODR = (Negative Feedback Rate + A-Z Claim Rate + Service Chargeback Rate) ÷ No. of Orders in the Last 60 Days
You can find information on your feedback status, A to Z claims, and chargebacks on the Seller Central dashboard under the ‘Performance Menu’.
Perfect Order Percentage
A perfect order is one where you receive an order, process it, fulfill it on time, and do not receive any negative feedback. Subsequently, a perfect order percentage is a ratio of your perfect orders versus the total number of orders you received.
Aim for a high percentage of perfect orders to boost your account health.
KPI Evaluation
Perfect Order Percentage = (No. of Perfect Orders ÷ Total No. of Orders) × 100
You can find data on your orders and feedback on the Seller Central dashboard under the ‘Performance Menu’.
Late Shipment Rate (LSR)
The LSR is a ratio of the number of orders you shipped later than expected versus the total number of orders.
It is advisable to keep this metric at 0 or as low as possible. A high LSR will impact your account health negatively.
KPI Evaluation
LSR = (Delayed Orders ÷ Total Orders) × 100
Valid Tracking Rate (VTR)
A VTR is a measure of functional tracking numbers that you upload every 30 days. A tracking number is considered functional if:
- You uploaded it before delivery
- It has a carrier scan (to indicate it was collected)
KPI Evaluation
VTR = (Valid Tracking Numbers ÷ Total No. of Tracking Numbers) × 100
Inventory Performance Index
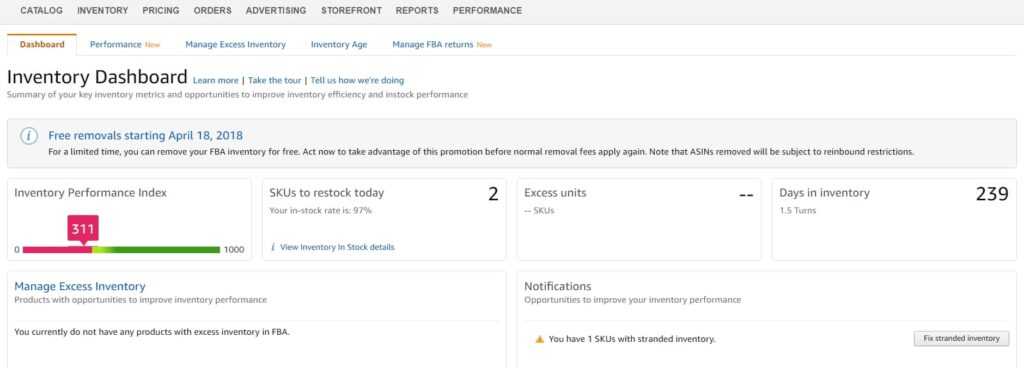
Amazon awards inventory performance indexes based on the flow of your FBA inventory. It is a number between 0 and 1,000 and the currently recommended limit is about 400.
Amazon determines your IPI based on:
- FBA In-stock Rate – this measures how well you maintain your inventory levels over 30 days versus your total sales over 60 days.
- FBA Sell-through Rate – units in stock versus the number of units you sell in 90 days.
- Excess inventory – the amount of inventory that exceeds your average demand over a 90-day window.
- Stranded inventory – the number of inventory units you have in an FBA warehouse that do not have active listings.
If you score an IPI below 400, Amazon may limit your FBA inventory storage or raise your storage fees.
KPI Evaluation
Amazon calculates IPI every quarter and 6 weeks before the end of every quarter. You can find it on your Seller Central dashboard under the Inventory menu.
Percentage Replenishable Out of Stock
This KPI indicates the number of sales you missed because one (or more) of your products is out of stock. It is a helpful metric to determine how much safety stock you may need. The higher the number of sales you are likely to miss the more safety stock you should have.
KPI Evaluation
% Replenishable Out of Stock = No. of Glance Views During Stock Out ÷ Total No. of Glance Views
Glance views are the number of Amazon shoppers that click to view a product detail page.
Negative Experience Rate (NCX)
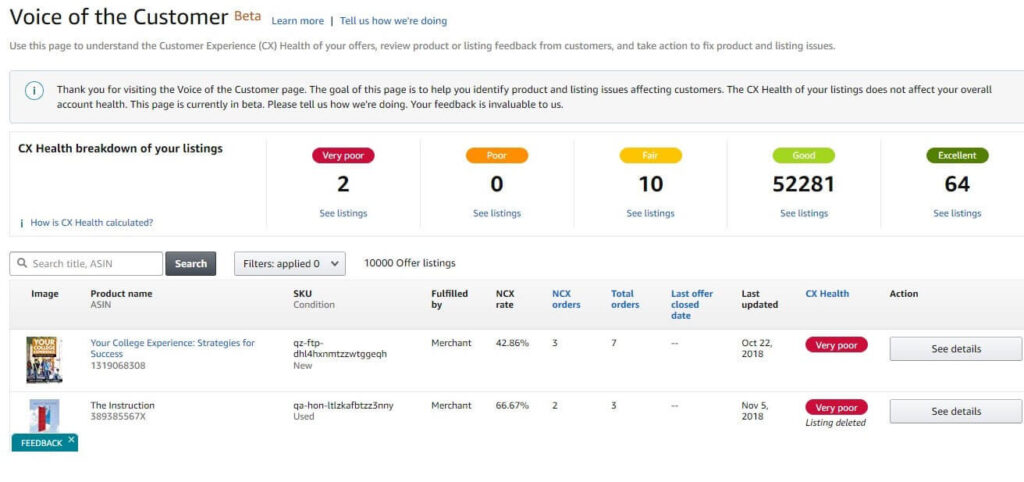
A negative experience rate measures the number of orders for a specific product that resulted in negative customer feedback.
An NCX is tied to a specific product. It is calculated based on :
- Messages from buyers to Amazon customer care
- The number of returns and refunds
- Negative reviews
It is best to keep your NCX rates low because Amazon closes offers/listings that have a record of a high NCX rate.
KPI Evaluation
Amazon displays your NCX rates for different orders in the ‘Voice of the Customer Dashboard’ in Seller Central. It updates as you complete orders and feedback comes in but you can check in as often as you like.
Customer Experience Health
Customer experience health measures your negative experience rate versus that of similar products.
For example, if you sell leather wristwatches, Amazon compares your NCX to that of other leather wristwatch sellers. It then determines customer experience health (CX) based on the various NCX rates.
KPI Evaluation
Amazon customer experience health ratings are accessible under the ‘Voice of the Customer Dashboard’ in Seller Central. It is a color-coded ranking scheme from red which denotes ‘very poor’ to green for ‘good’.
Account Health Rating

Your account health rating is a general analysis of your performance as an Amazon seller. Amazon evaluates it based on how well you follow its rules and the limits it sets for various factors.
KPI Evaluation
You can find all the information about your Amazon account health rating in the Seller Central dashboard under the ‘Account Health’ menu.
Amazon offers color-coded ratings for this too. Red shows critical health, yellow shows your account is at risk, and green represents good health.
You may also spot occasional red flags in the policy compliance section if you break any rules.
FAQs about Amazon KPIs
How Often Should I Evaluate Amazon KPIs?
There is no set time limit for monitoring your Amazon KPIs. However, you could review them every month so that you can correct any negative performance issues early enough.
On the flip side, this may not apply to all Amazon KPIs. For instance, in some cases, only Amazon can evaluate a specific KPI. You would thus have no choice but to work with Amazon’s schedule.
Which Is the Easiest Way to Monitor Amazon KPIs?
The Amazon Seller Central dashboard is a very resourceful tool. You can directly find some Amazon KPIs for your account in your seller reports or find the data you need to calculate specific KPIs.
Alternatively, you could consider subscribing to an Amazon seller tool that can collate all your seller account details and present your various KPIs regularly.
In Conclusion
Amazon KPIs can seem like a noose around your entrepreneurial neck but they are not. Amazon only uses them to motivate you to work hard and make your business thrive while also delivering the stellar shopping experience associated with the brand.
We, at NicheSources, on the other hand, strive to make selling on Amazon easy for you. Our comprehensive services include product sourcing, product development, and global shipping. We are also well-equipped to prepare and ship your FBA inventory.
So, why struggle when you can have professionals do it for you? Simply send us a detailed brief of your sourcing requirements, request a quote, and leave it all to us.